
65 of the best stats sections















Stats sections FAQs
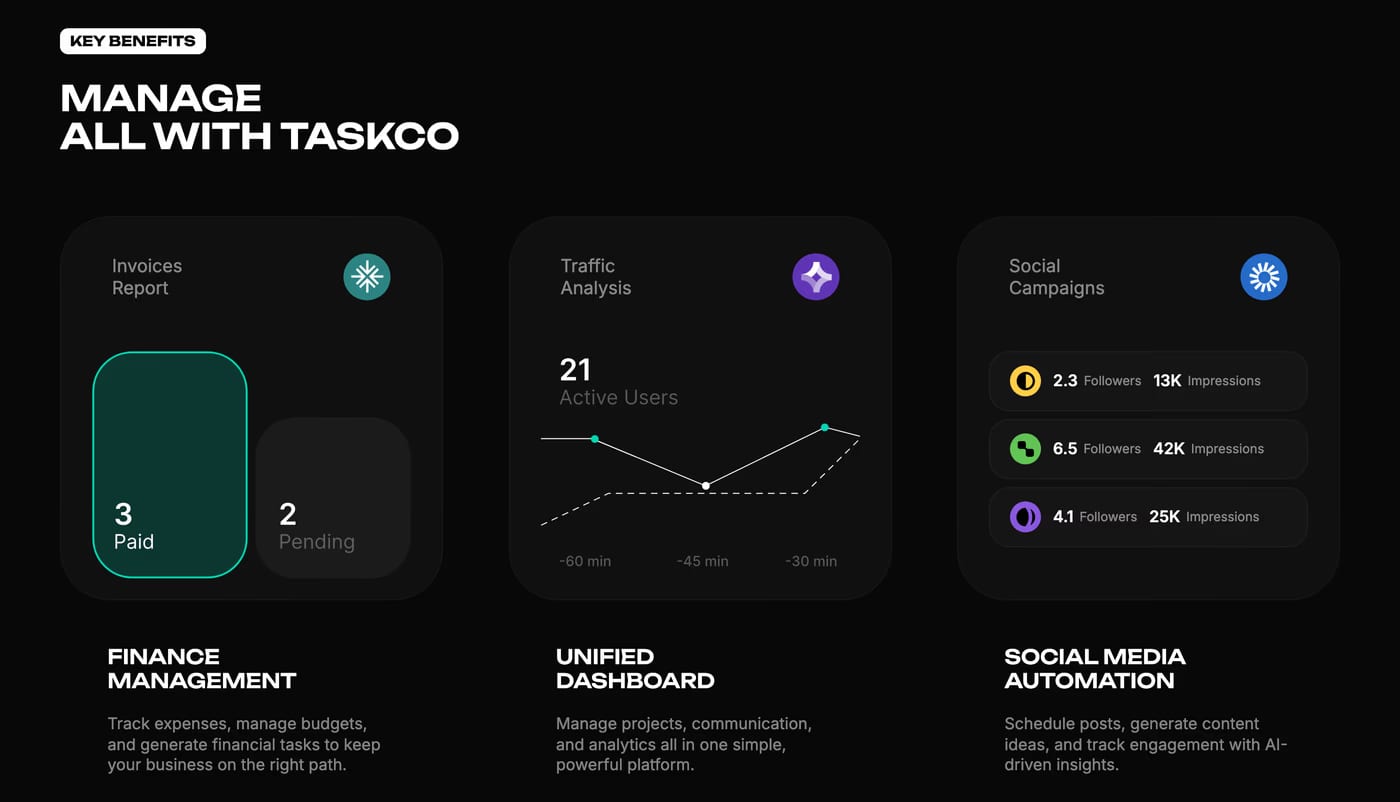
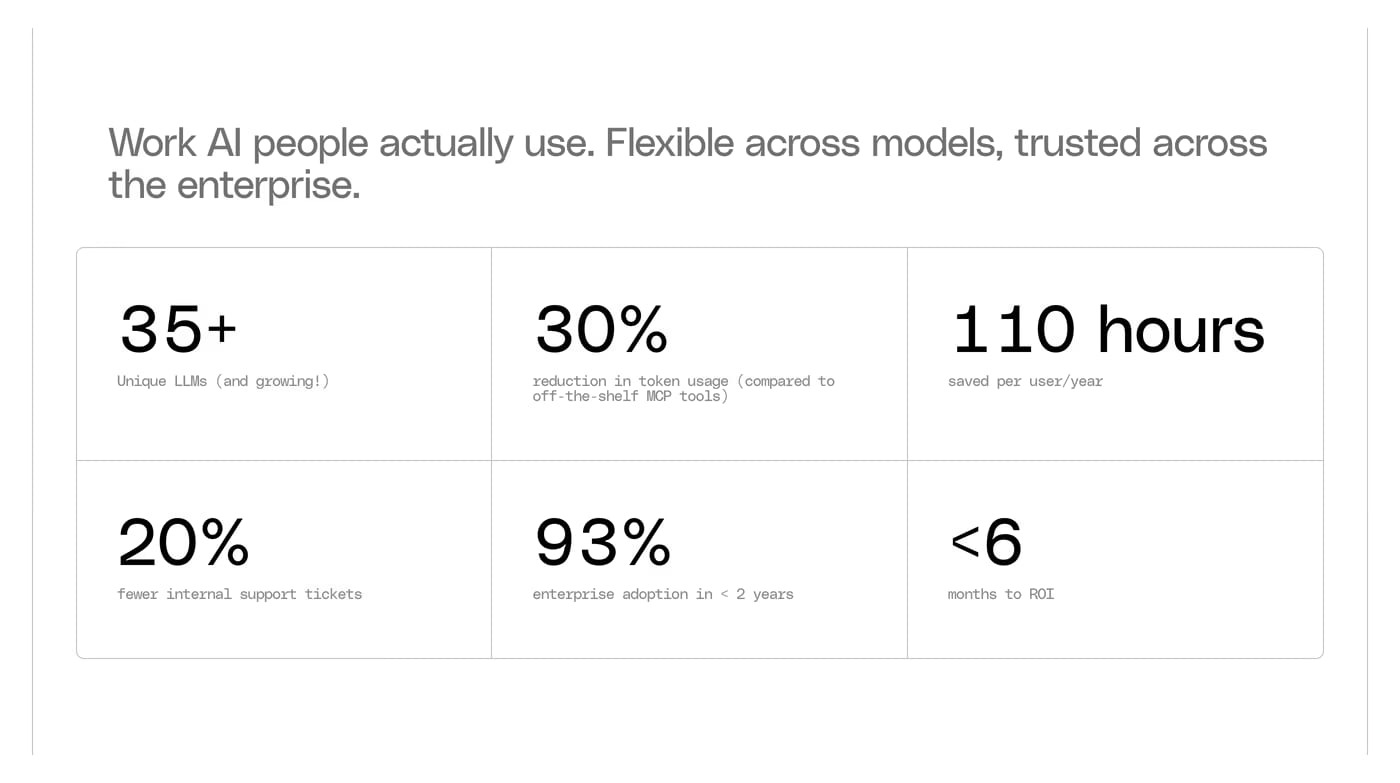
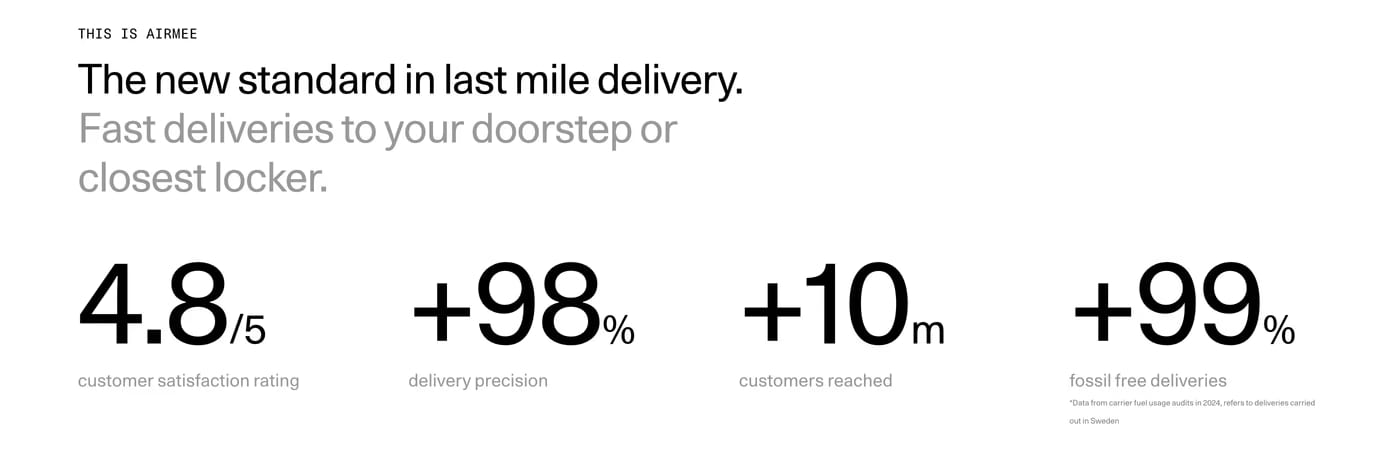
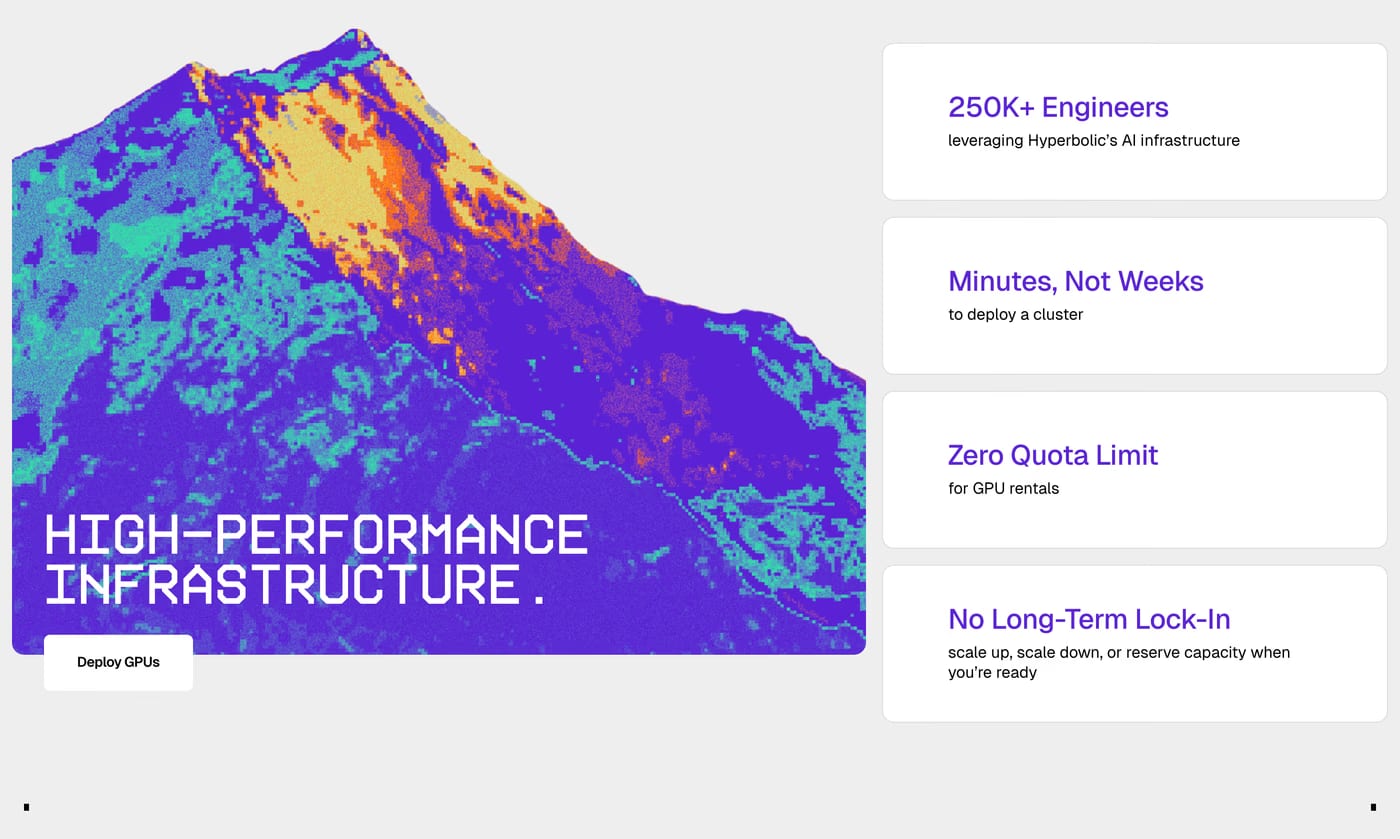
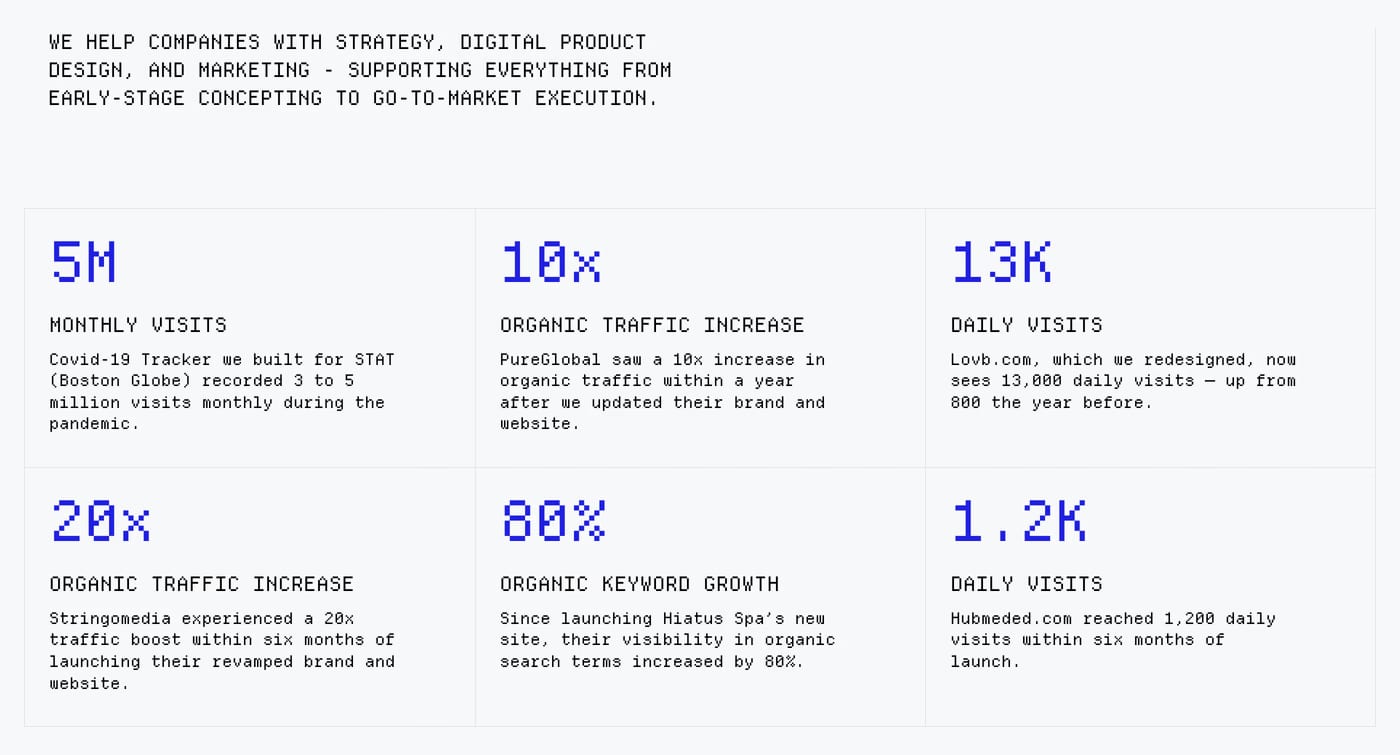
Customer-facing numbers that prove value: users, revenue growth, uptime, satisfaction scores, or time saved. Avoid internal vanity metrics. If the number doesn't mean something to your customer, don't show it.
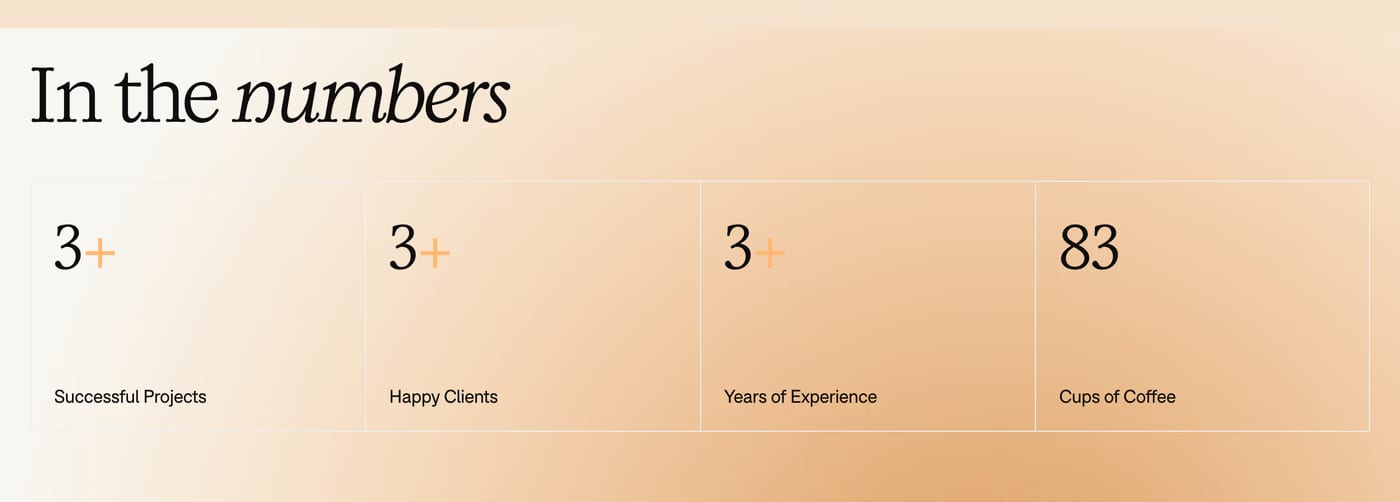
Round up to round numbers where honest — "5,000+ customers" reads better than "4,843 customers". Millions and billions should use abbreviations (1.2M, $2B). Large typographic numbers with a supporting label perform better than small inline stats.
After the hero or features section, before testimonials. They work as a "proof point" that validates the claims made earlier. Placing stats before testimonials creates a logical flow: claim → numbers → social proof.