Updated
Curated inspiration sent every Tuesday
Unsubscribe at any time
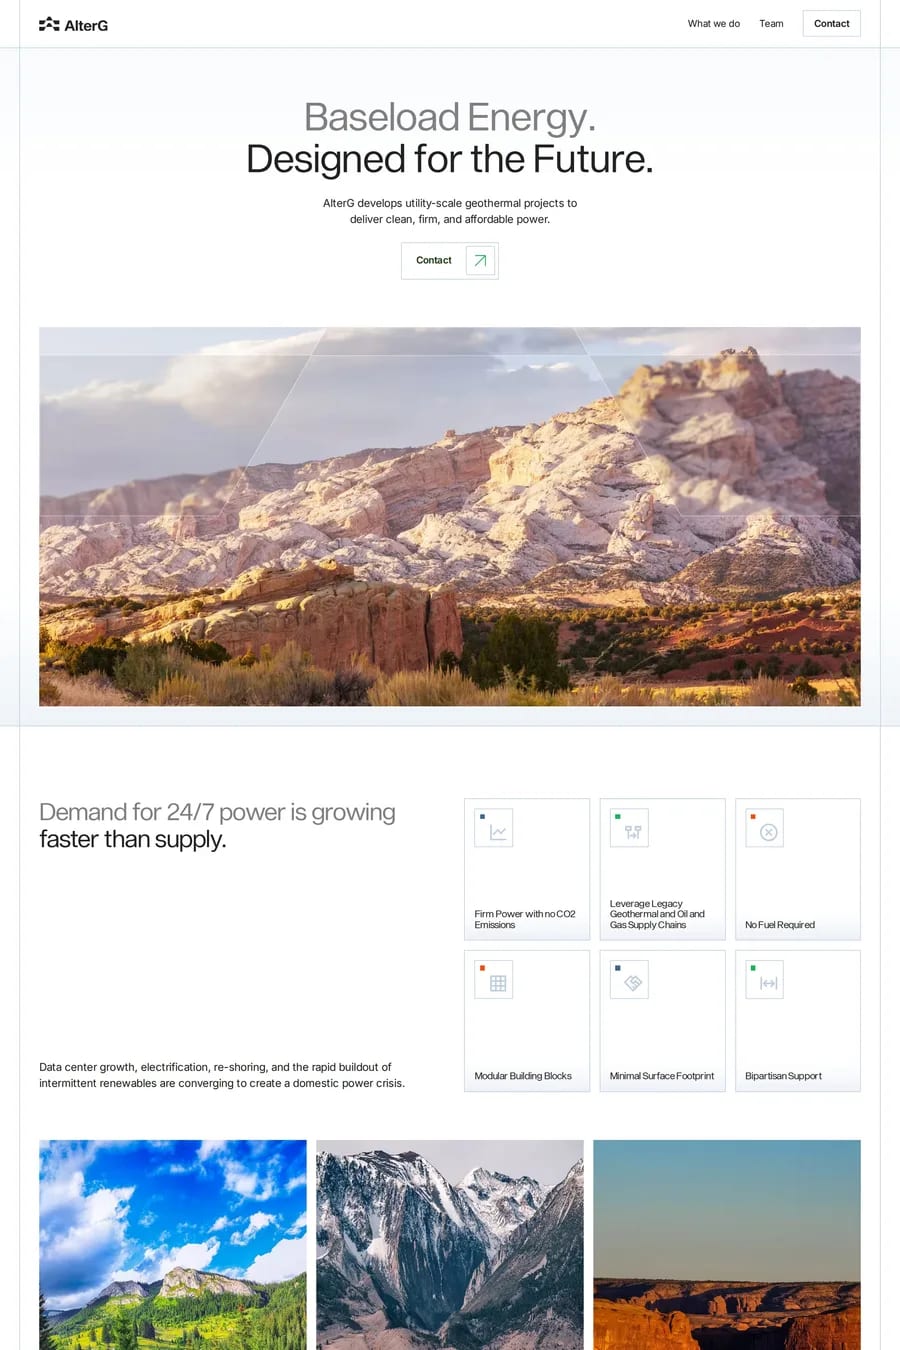
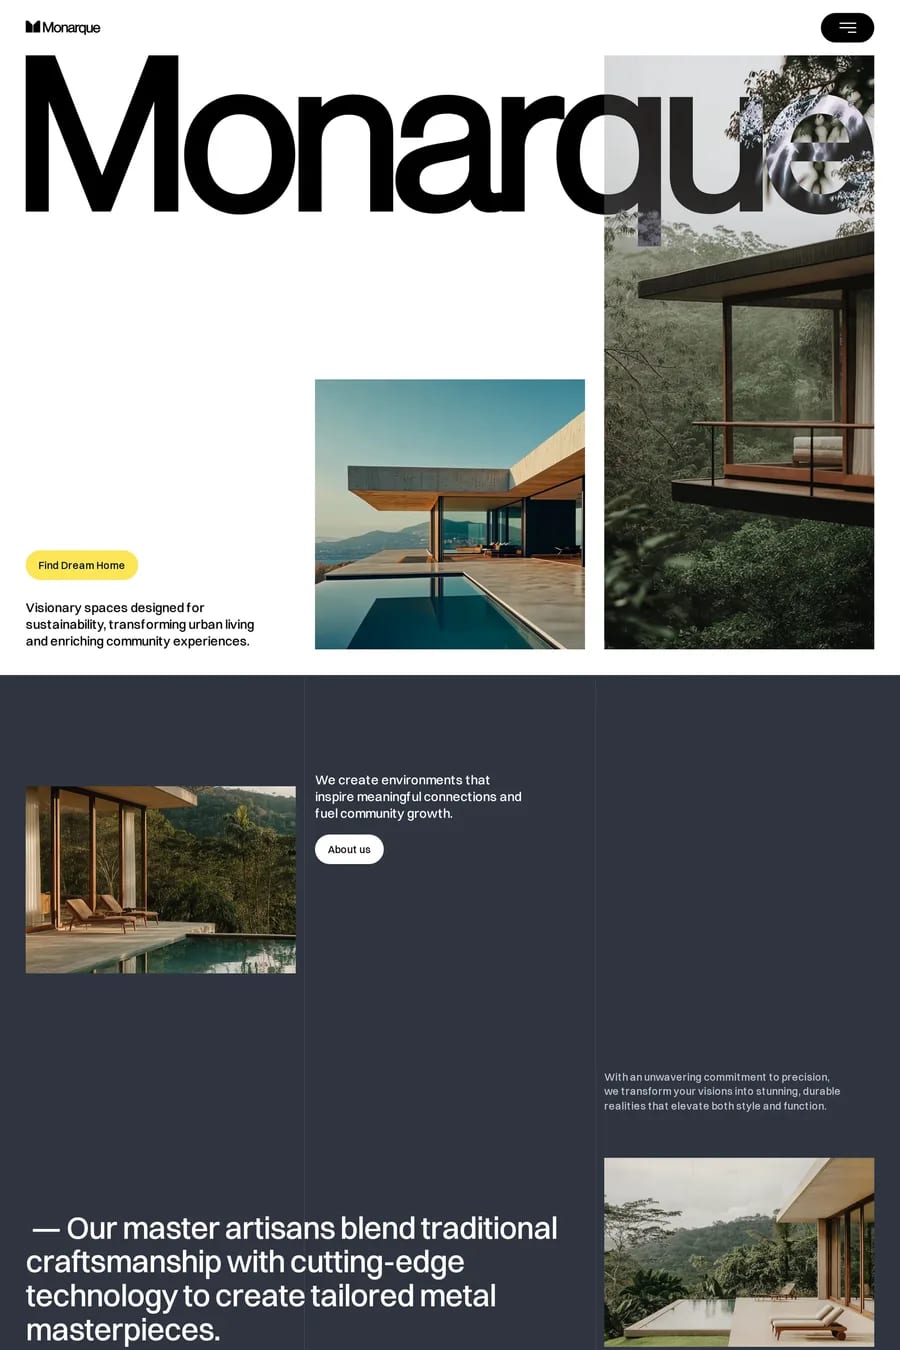
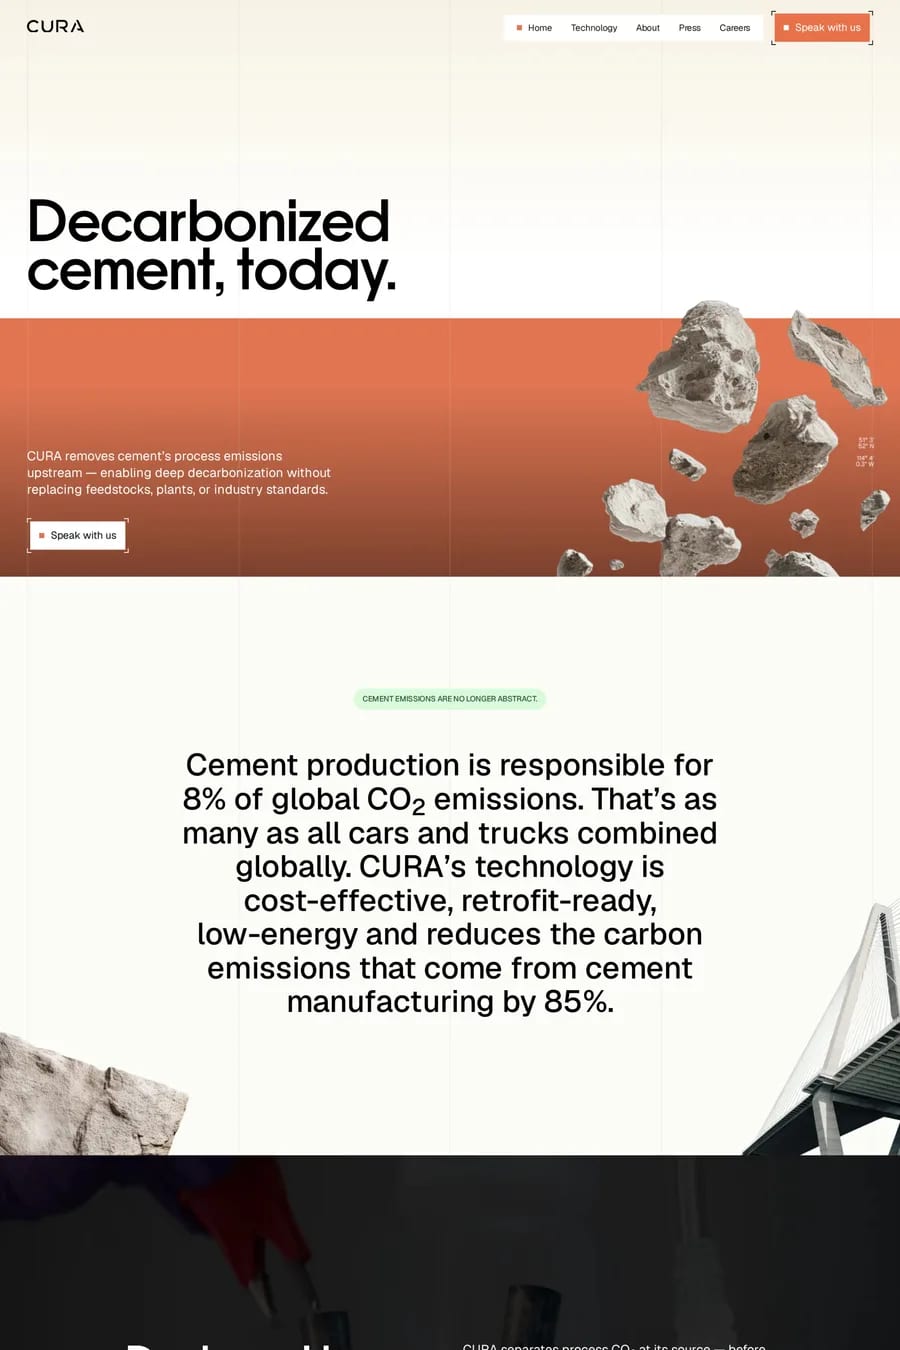
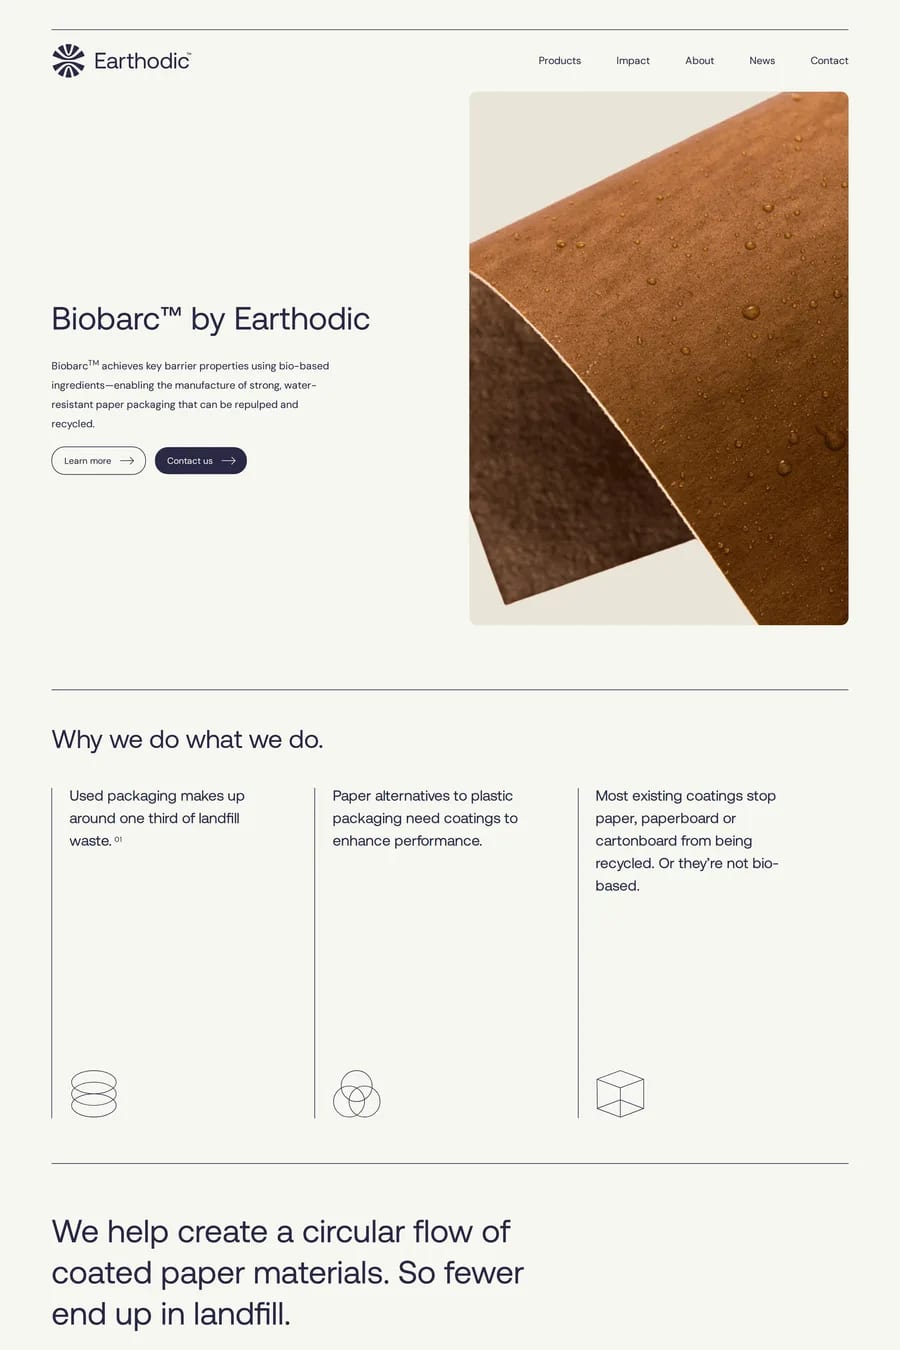
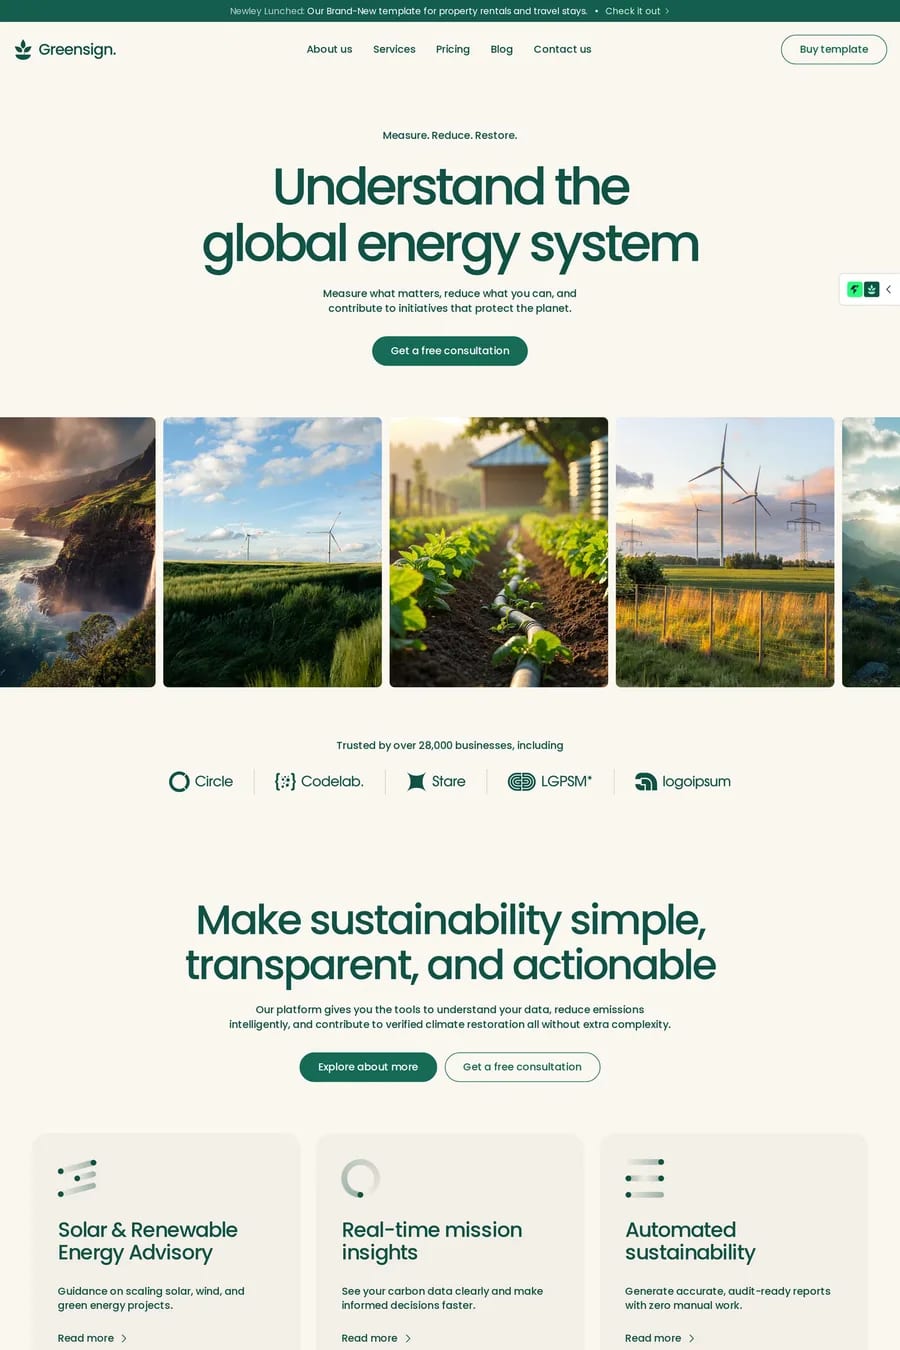
Earthy greens, ocean blues, and warm ambers are common foundations, often contrasted with stark blacks or whites for data visualisation. These palettes root the design in nature while maintaining enough contrast for readability and accessibility.
The best examples use animated charts, interactive maps, and scroll-triggered infographics to make climate data digestible. Breaking large datasets into focused, narrative-driven sections prevents information overload and keeps visitors engaged.